
Measure Better, Optimize Smarter, Sell More Summit Tickets
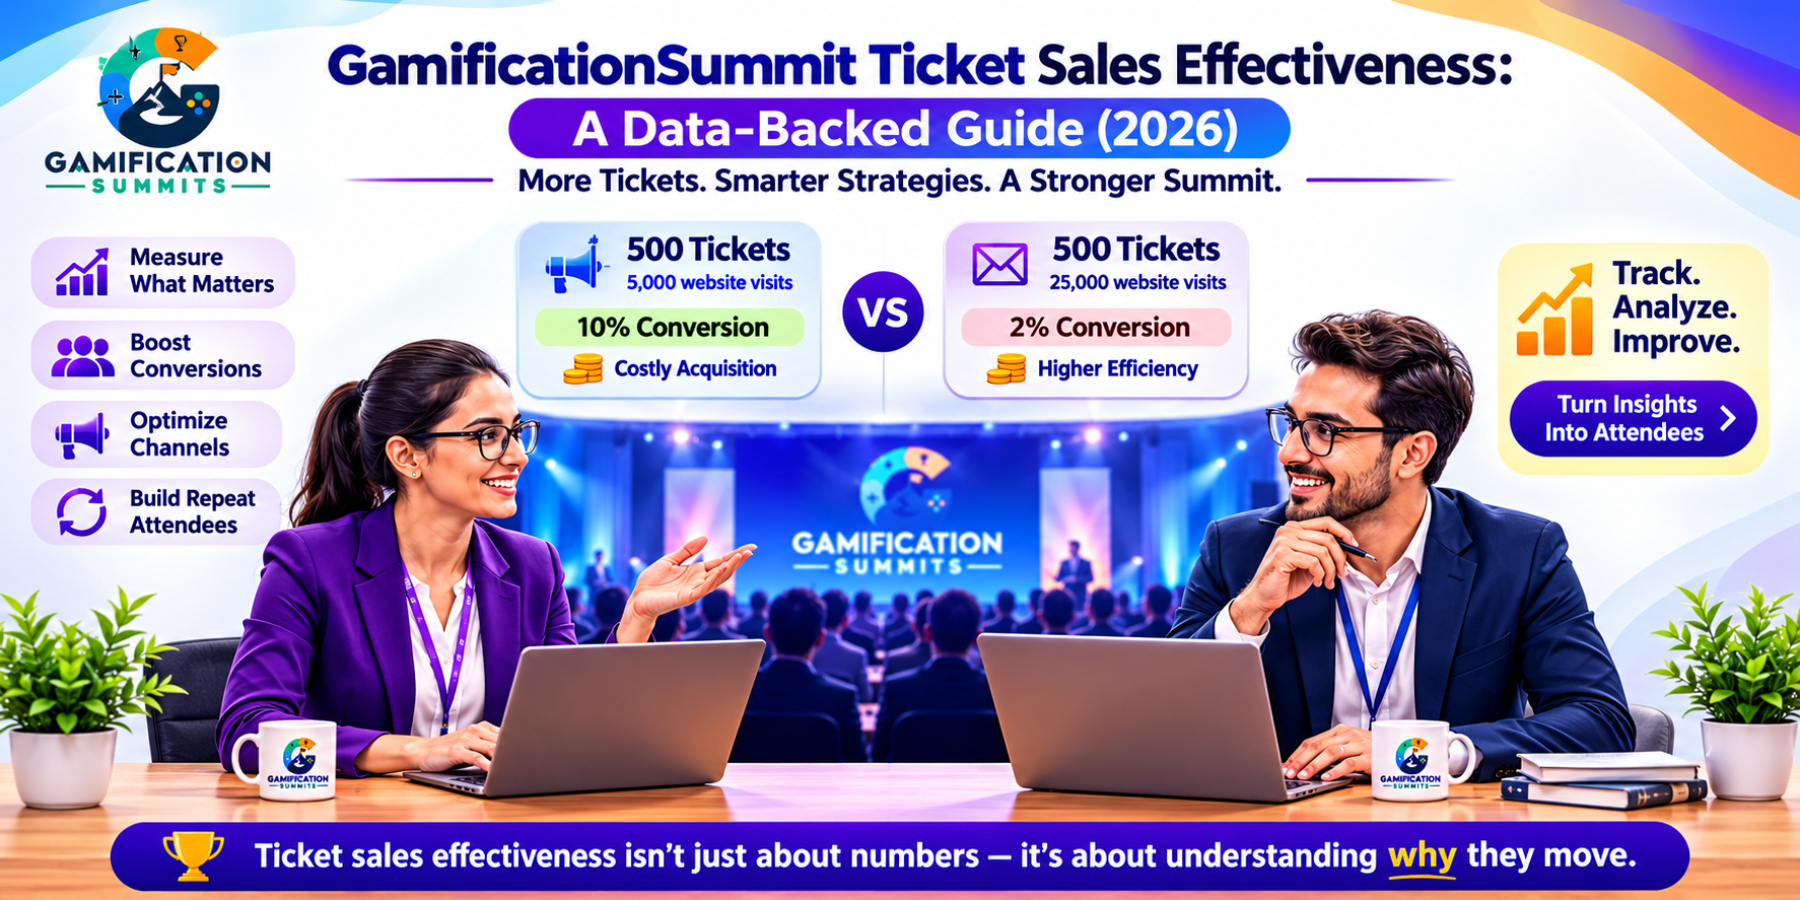
Picture two GamificationSummit organizers comparing notes after their events. Both sold 500 tickets. Both call it a win.
But one spent heavily on paid advertising to get there, while the other filled most of those seats through referrals, email, and returning attendees who already knew the event was worth attending.
“Same ticket count. Very different results.”
That gap is what ticket sales effectiveness is really about. Most event organizers track the obvious number: tickets sold. They celebrate when it goes up and worry when it goes down. But that number alone doesn’t tell you which channel actually worked, where potential buyers dropped out, how much it cost to acquire each attendee, or whether this year’s campaign is genuinely more efficient than last year’s.
For a GamificationSummit, those questions matter even more. The event is about engagement, behavioral design, and game mechanics — so the ticket-selling process itself should be measurable, testable, and continuously improvable. This guide explains what ticket sales effectiveness means, which benchmarks are actually useful, and the metrics GamificationSummit organizers should track from one ticket cycle to the next.
What “Effectiveness” Actually Means
Go back to those two organizers. The first got 500 buyers from 5,000 website visits — a 10% conversion rate.
The second needed 25,000 visits for the same 500 tickets — a 2% conversion rate. On the surface, they achieved the same result. Underneath, the first campaign was converting traffic five times more efficiently.
That distinction becomes even more important over multiple ticket cycles. An organizer with a stronger conversion rate can generate more sales from the same audience, reduce dependence on paid acquisition, identify effective messaging faster, and build a larger base of past attendees who can be marketed to again.
An organizer with weak conversion may have to keep buying more traffic simply to produce the same number of tickets. So ticket sales effectiveness isn’t one magic score. It’s the relationship between traffic, conversion, acquisition cost, revenue, and repeat demand.
A useful starting set of questions is:
- How many visitors become buyers?
- Which channels generate those buyers?
- How much does each channel cost?
- How many people start checkout but don’t finish?
- How many buyers return for the next summit?
Answer those consistently, and your ticket count becomes much more useful because you understand why it moved.
The Conversion Rate Benchmark — And Why the Number Varies
Search for “average event ticketing conversion rate” and you’ll find surprisingly different answers. That’s not necessarily because the research is contradictory. Often, the studies are measuring different things.
One recent event-ticketing benchmark puts typical event website conversion around 2% to 5%, while noting that niche events with highly targeted audiences can perform significantly better. AudienceView reports a much higher 12.6% average online conversion rate across its dataset of 1,133 live-event organizations, 5.7 million website sessions, and more than 720,000 ticket transactions. But its definition is transactions divided by sessions, not necessarily unique visitors to a ticket landing page.
That distinction matters.
A visitor who arrives through a cold paid-social campaign has very different purchase intent from a returning attendee clicking a reminder email. A benchmark built from highly engaged live-event traffic shouldn’t automatically become the target for every event website.
The practical lesson is simple:
“Don’t compare conversion percentages until you’ve confirmed that the underlying calculation is comparable.”
For planning purposes, a broader 2%–5% event-site range is a reasonable starting reference for many organizers, while higher figures can be achievable when traffic is highly targeted and intent is strong. More importantly, track your own conversion rate consistently. If your GamificationSummit moves from 2.4% to 3.6% with similar traffic quality, that’s a meaningful improvement even if another event reports a completely different headline number.
The Market Context: A Growing Ticketing Category
Online event ticketing is a large global market and continues to expand. The Business Research Company estimates the global online event ticketing market at $53.04 billion in 2025, growing to $56.58 billion in 2026, with a projected value of $71.54 billion by 2030. Its 2026 report identifies factors including wider digital commerce adoption, digital payments, event-management software, mobile-first ticketing, and personalized ticketing experiences as important market drivers. For summit organizers, the important point isn’t the market-size number itself.
It’s the direction of the market. Buyers increasingly expect ticketing to be convenient, digital, and low-friction. That means the quality of the ticket buying journey matters alongside the quality of the event itself. If your event page takes too long to load, hides important pricing information, creates unnecessary checkout steps, or makes payment difficult on mobile, additional marketing traffic won’t necessarily solve the problem.
You may simply be sending more people into a leaky funnel.
Gamification’s Real Role in Ticket Sales
There’s an obvious question for a GamificationSummit:
If the summit is about gamification, should the ticket-buying experience use gamification too?
Potentially — but only when the mechanic supports a measurable business objective. Ticket Fairy’s 2026 event-marketing guidance highlights points, challenges, referral programs, and rewards as ways event marketers can increase engagement and encourage sharing. It reports a potential 30%–60% engagement increase from gamified approaches, but engagement should not be confused with completed ticket purchases.
That distinction is important.
More clicks don’t automatically mean more revenue.
A leaderboard might generate plenty of interaction but very few additional purchases. A referral reward, on the other hand, can directly connect participation with ticket sales. Ticket Fairy reports that organizers using its referral system have seen a 15%–25% increase in ticket sales, although that figure is platform-specific and shouldn’t be treated as a universal industry benchmark. For GamificationSummit, the best approach is therefore not “gamify everything.”
Instead, choose mechanics that have a clear job:
- Referral rewards → increase buyer-driven acquisition
- Progress indicators → make checkout feel easier to complete
- Limited-time unlocks → reinforce early-bird urgency
- Status or loyalty tiers → encourage repeat attendance
- Challenges or leaderboards → increase sharing and participation
Then measure whether the mechanic actually changes the metric it was designed to influence.
A Practical Framework: What to Track
Rather than trying to create one complicated effectiveness score, track a small group of metrics consistently across every ticket cycle.
1. Conversion Rate
Calculate ticket purchases relative to the traffic metric you’re using.
For example:
Conversion rate = ticket purchases ÷ ticket-page visitors × 100
Be consistent about whether you’re using unique visitors, sessions, or another denominator. Don’t compare a unique-visitor conversion rate with a sessions-based benchmark without noting the difference. Track it weekly while tickets are on sale.
A falling conversion rate can indicate a change in traffic quality, pricing, messaging, page experience, or checkout friction.
2. Channel Source
Know where buyers came from.
Break sales down by:
- Organic search
- Paid social
- Organic social
- Referrals
- Partners or speakers
- Direct traffic
Use UTM parameters before the campaign begins. Without consistent attribution, you may know that 500 people bought tickets without knowing which 500 marketing interactions actually produced those purchases.
3. Cart Abandonment
Track how many people begin checkout but don’t complete the purchase. These visitors have already demonstrated intent, so they can represent a valuable re-engagement audience. Possible reasons for abandonment include:
- Unexpected fees
- Complicated forms
- Limited payment options
- Slow pages
- Lack of trust signals
- Unclear ticket terms
- Mobile usability problems
Don’t assume the solution is always a discount. First find out what is creating the friction.
4. Early-Bird Uptake
Measure how much of your total sales volume arrives during the first one or two weeks. This helps you understand whether your initial launch is creating enough momentum. A slow start doesn’t automatically mean the event is unpopular. It could indicate that the announcement reached the wrong audience, the value proposition wasn’t clear, the pricing structure was confusing, or the buying experience created friction. The key is to diagnose the cause rather than immediately increasing ad spend.
5. Repeat-Attendee Rate
Track what percentage of this year’s buyers attended a previous GamificationSummit. This is one of the most strategically important numbers because returning attendees already know the event. A growing repeat-attendee base can reduce your dependence on cold acquisition and create a stronger foundation for future launches. Don’t look at repeat attendance alone, though. Pair it with new-attendee acquisition.
A rising repeat rate is positive if your overall audience is also growing. If repeat attendance rises only because fewer new people are entering the funnel, it can hide a different problem.
Where Gamified Mechanics Fit
| Metric | Gamified mechanic | What to measure |
|---|---|---|
| Conversion rate | Checkout progress indicator or milestone | Checkout completion |
| Channel source | Referral leaderboard or ambassador rewards | Referred ticket sales |
| Cart abandonment | Return-to-complete incentive | Recovered purchases |
| Early-bird uptake | Time-limited rewards or unlocks | First 7–14 day sales |
| Repeat-attendee rate | Loyalty/status tiers | Returning-buyer registrations |
The important word is measure.
A gamified element should have a hypothesis behind it.
For example:
“If we introduce a referral reward, referred sales should increase without increasing paid acquisition spend.”
That’s much stronger than:
“Let’s add a leaderboard because gamification is our theme.”
The first can be tested.
The second is decoration.
A Simple Effectiveness Example
Imagine two GamificationSummit campaigns each receive 10,000 relevant visitors. Campaign A converts at 2%.
That’s 200 tickets.
Campaign B converts at 5%.
That’s 500 tickets.
>Same traffic. Same audience size. Same opportunity.
The difference is 300 additional tickets from improving the conversion process rather than simply buying more traffic. That’s why conversion optimization can have such a large impact on ticket sales effectiveness.
And the same principle applies to acquisition channels. Suppose email generates 100 ticket purchases from an existing audience while paid social generates another 100 purchases at a much higher cost.
The ticket count makes both channels look equally successful.
The effectiveness analysis does not.
It asks:
- What did each channel cost?
- What was the conversion rate?
- How much revenue did each produce?
- Did those buyers return?
- Did they refer other attendees?
That is the level at which meaningful optimization happens.
A Word on Benchmarks and Sources
Event-ticketing benchmarks are useful, but they should be treated as reference points rather than universal targets.
Different studies may measure:
- Sessions vs. unique visitors
- Transactions vs. tickets
- All website traffic vs. ticket-page traffic
- New visitors vs. returning visitors
- Different event categories
- Different ticket prices
- Different levels of buyer intent
That’s why a single “average conversion rate” can be misleading.
For GamificationSummit, the strongest benchmark is a combination of:
- Your own historical performance
- Comparable event benchmarks
- Channel-specific performance
- Device-specific performance
- Revenue and acquisition-cost data
The goal isn’t to beat an arbitrary industry percentage.
The goal is to make each ticket cycle more efficient than the previous one.
Primary Sources
- AudienceView — Online Conversion Rate Benchmark for Live Events
- The Business Research Company — Online Event Ticketing Market Report
- Ticket Fairy — Gamification for Event Promotion
- Ticket Fairy — Referral Marketing for Events
The Bottom Line
Go back to those two organizers one final time. Both sold 500 tickets. But one needed 5,000 visitors to do it, while the other needed 25,000. One relied primarily on referrals and returning attendees. The other depended heavily on paid acquisition. Their ticket counts were identical. Their ticket sales effectiveness was not.
That’s why GamificationSummit should track more than tickets sold. Monitor conversion rate, channel attribution, cart abandonment, early-bird uptake, and repeat-attendee rate. Use gamified mechanics when they have a measurable purpose, and test whether they actually improve the outcome you’re targeting.
Most importantly, compare the same metrics from one campaign to the next. When you do that consistently, your ticket campaign stops being a yearly guessing game. You know which channels are working; where where buyers are dropping out; which experiments are worth repeating; And you know what needs to change before the next ticket cycle begins
That’s what ticket sales effectiveness really means: not simply selling more tickets, but understanding how efficiently your entire ticket-selling system turns attention into attendance.